The MSP industry has witnessed a meteoric rise, positioning itself as the ultimate problem-solvers for businesses seeking efficient, cost-effective IT solutions. From ensuring cybersecurity to facilitating cloud migrations, MSPs have become the backbone for many businesses aiming for scalability and resilience.
If you're an MSP or even just thinking of diving into this industry, there's something you absolutely can't ignore: Metrics. Let's dive deep into the key metrics MSPs should monitor to optimize technicians’ performance.
1. First Response Time
This is a critical metric for MSPs to keep track of. First response time measures how quickly technicians address an issue after a ticket is raised or an issue is reported. It shows you how quickly your tech team is on the issue. Prompt and quick response times boost client trust, bring satisfied customers, and foster longer-term business relationships.
2. Resolution Time
Beyond the first response, clients are keen on how quickly their issues are resolved. Monitoring the average time taken to close tickets can provide insights into the efficiency and efficacy of your technicians. Faster the resolution, the better.
3. Customer Satisfaction Score
The Customer Satisfaction Score (CSAT) is a direct metric used to assess short-term customer satisfaction. This metric gives direct feedback on a technician's performance. This metric often correlates with customer retention metrics and can signal areas for technician training or process improvement.
4. Tickets Handled Per Technician
This metric provides a clear picture of the workload distribution among technicians. By analyzing it, MSPs can identify overburdened technicians and reallocate resources as needed. You can also use AI tools to assign agent tickets based on their workload to balance things out.
5. Ticket Escalation Rate
While first-level technicians can't solve every issue, a high ticket escalation rate might suggest a gap in training or resources. This metric can help MSPs determine where more training or support is needed. Facing a high escalation rate? Time to level up the training or bring in some backup.
6. Service Level Agreement (SLA)
Service Level Agreement measures how consistently an MSP meets or exceeds the agreed-upon service levels with their clients. These service agreements often outline response times, resolution times, uptime guarantees, and other key service commitments. It provides invaluable insights into the business's health, client satisfaction, and internal efficiency.
7. Overall Profitability Per Technician
By evaluating the revenue generated relative to each technician’s compensation, MSPs can gain insights into the ROI they're getting for each technician employed. It will offer you a clear picture of every dollar you spend on our technicians, how much are you making back?
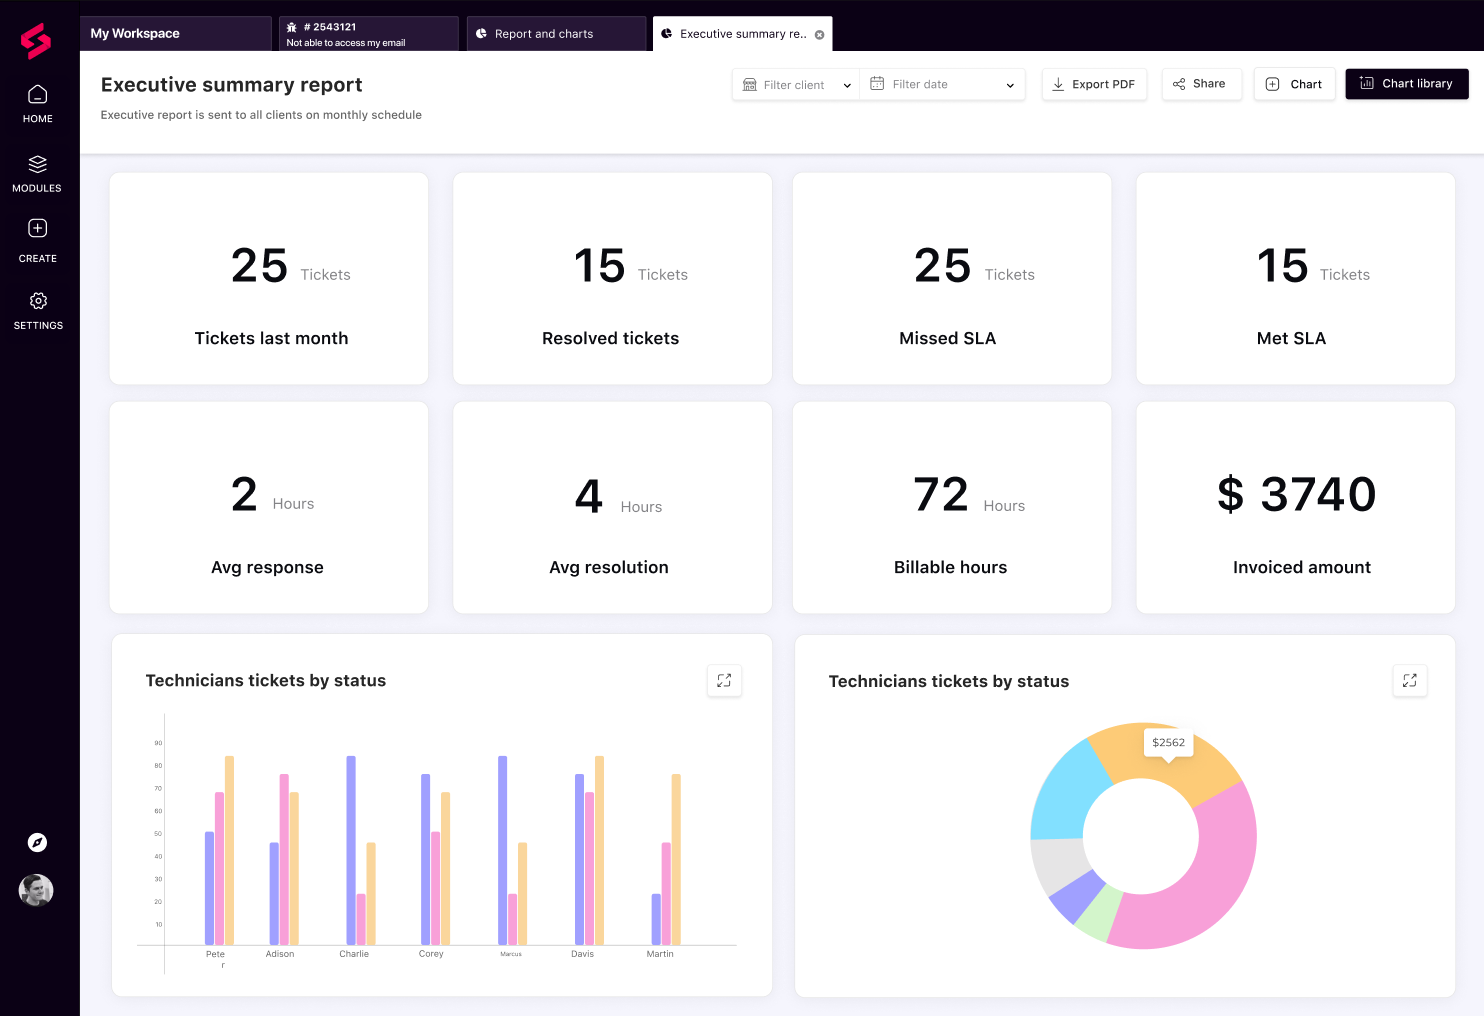
Pro Tip: Whether you're aiming to enhance client communication, streamline internal processes, or optimize resource allocation, SuperOps.ai’s reporting feature offers you insights into all metrics for data-driven success. Explore more about streamlined reporting here and witness the transformation firsthand.

Bonus: Operational Metrics for Comprehensive Insights
Here are a few metrics that you should track along with the technician metrics to boost business operations.
8. Monthly Recurring Revenue
MRR represents the predictable revenue that an MSP can expect to receive every month from its subscribed customers. MRR helps forecast, budget, and gauge revenue stream stability. A steadily increasing MRR indicates sustainable business growth.
It is calculated by multiplying the total number of paying customers by the average revenue per user (ARPU) per month.
9. Customer Acquisition Cost (CAC)
CAC measures the average expense of acquiring a new customer, including marketing, sales, and any related costs. Understanding CAC helps MSPs determine the ROI of their marketing strategies and whether they're spending efficiently to acquire new clients.
CAC is calculated by dividing all sales and marketing costs by the number of new customers gained within a specific period.
10. Customer Churn Rate
This metric determines the percentage of clients who end their relationship with the MSP during a specific timeframe. A high churn rate is a red flag, signaling dissatisfaction, and underscoring the need for service improvements or better client relations.
There you have it! In the MSP world, it's not just about having the tech skills but knowing the numbers that make the magic happen. By staying on top of these metrics, MSPs can make informed decisions, boost profitability, and ensure they deliver the value that clients expect.


